Last year we set up Hudson to build the Industrial SQL Connector for Mylyn, a DIY connector project to connect Mylyn to a local SQL database for which I'm a committer. This blog post I will explain how I set up static code analysis on the same project using SonarQube. Installing and setting up SonarQube is better explained elsewhere, like http://www.sonarqube.org, but then setting up a set op eclipse plugin projects to be analyzed is more specific.
Preparation:
- Install SonarQube following instructions here.
- Then install the Sonar plugin into Hudson using Update Center and configure it following these instructions
- Lookup how to build the Industrial SQL Connector for Mylyn with Hudson here
Configuring the Industrial SQL Connector for Mylyn for analysis
Whether you want to analyze projects with the Maven
sonar:sonar target or use the Hudson
Invoke Standalone Sonar Analysis build step in both cases you need to create a
sonar-project.properties file.
As a matter of common sense I always put this file in the same project as the project with the maven master POM, in this case
com.industrialtsi.mylyn.maven.
# required metadata
sonar.projectKey=com.industrialtsi.mylyn
sonar.projectName=Industrial SQL Connector for Mylyn
sonar.projectVersion=0.9.10-SNAPSHOT

# optional description
sonar.projectDescription=Industrial SQL Connector for Mylyn

# path to source directories (required)
#sonar.sources=src THIS IS SPECIFIED PER MODULE

# path to project binaries (optional), for example directory of Java bytecode
#sonar.binaries=target/classes THIS IS SPECIFIED PER MODULE

# optional comma-separated list of paths to libraries. Only path to JAR file is supported.
#sonar.libraries=lib/*.jar THIS IS SPECIFIED PER MODULE

# The value of the property must be the key of the language.
sonar.language=java

# modules one for each area of functionality, only plugin and fragment projects
sonar.modules=core,derby,jpa,memory,ui

# setup project base dir
core.sonar.projectBaseDir=com.industrialtsi.mylyn.core
derby.sonar.projectBaseDir=com.industrialtsi.mylyn.demo.derby
jpa.sonar.projectBaseDir=com.industrialtsi.mylyn.demo.jpa
memory.sonar.projectBaseDir=com.industrialtsi.mylyn.demo.memory
ui.sonar.projectBaseDir=com.industrialtsi.mylyn.ui

#set up source folders
core.sonar.sources=src
derby.sonar.sources=src
jpa.sonar.sources=src
memory.sonar.sources=src
ui.sonar.sources=src

# set up binary folders
core.sonar.binaries=target/classes
derby.sonar.binaries=target/classes
jpa.sonar.binaries=target/classes
memory.sonar.binaries=target/classes
ui.sonar.binaries=target/classes

# set up libraries folders, where jars reside
core.sonar.libraries=
derby.sonar.libraries=lib/*.jar
jpa.sonar.libraries=lib/*.jar
memory.sonar.libraries=
ui.sonar.libraries=
Then we commit this file to the repository so Hudson can retrieve it.
Configuring Hudson to analyze the project
We go to the Hudson Job tab and press configure. Under
Build we add a step
Invoke Standalone Sonar Analysis and configure it as follows:

Building and examining the results
We make Hudson build the project and then go over to the SonarQube pages for the results, note that I have created a custom set of my favorite widgets for this:
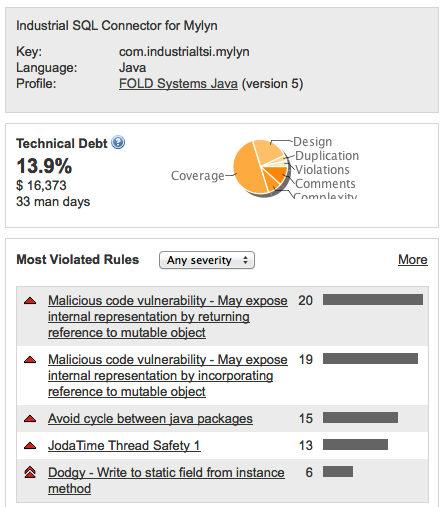
The Technical Debt widget tell us the technical debt in days, and also a percentage split of the main problems.
Lack of coverage explains half the debt, with design, comments and complexity as other issues. There are very few violations and duplications, the happy result of running with Checkstyle, Findbugs and PMD inside Eclipse during the development.
I always add a
Most Violated Rules widget to the project dashboard. Exposing internal representation is the most common here as the very bad package cycles.
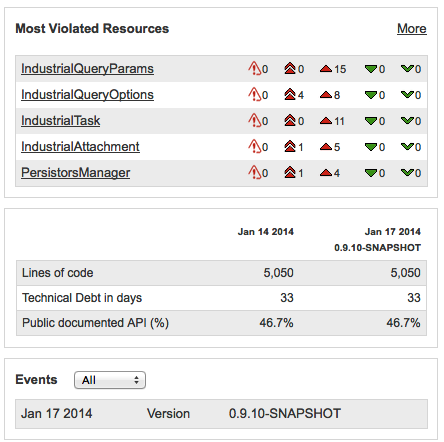
The "Most Violated Resources" widget instantly tells me that the objects used to ferry query parameters around are the main problem area. I have a tagged sonar-project.properties file so I will be able to see progress in the future on lines of code, technical debt and documented API.
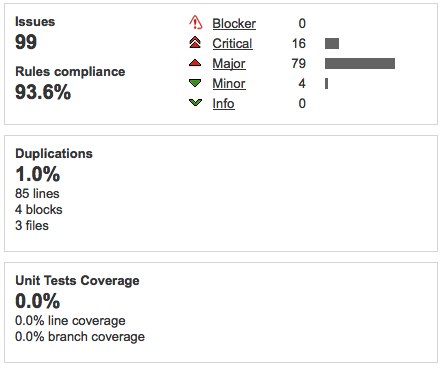
Issues are mostly Critical and Major, so need to be fixed urgently. 1% duplications is not that serious, even though 0% is best of course. Test coverage is more serious as we've seen above that lack of Test Coverage accounts for half of technical debt. This maybe because the build is not yet configured to execute tests.
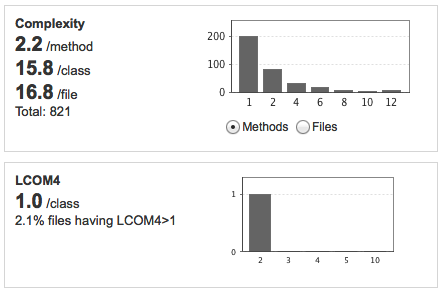
The complexity stats show mainly whether design is good, a method should do one thing, a class should have one responsibility. The LCOM4 measure of 1.0/class is quite positive.
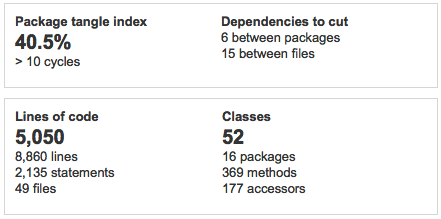
The main problem in these is the startling 40.5% of package tangle index and more than 10 cycles!
This needs to be looked at with highest priority.
Action Plan
So this short exercise (total time to setup 1,5 hours) revealed quite a lot of
potential problems in the code base! How then to tackle and resolve these problems?
- Ensure that the unit tests are executed and measured! Without unit tests we cannot begin to refactor safely.
- Fix the Critical Issues in the code, but only when adequately covered by unit tests
- Investigate and fix the Package Cycles problems, but again only when adequately covered by unit tests
- Fix the Major Issues in the code, but only when adequately covered by unit tests
- Fix the Code Duplications problems
I will report on my findings here.
For unit test coverage I'm going to use
Jacoco, which works well inside Eclipse using the Eclemma plugin, is preferred by SonarQube and can also be integrated with Tycho/Maven.

 The Technical Debt widget tell us the technical debt in days, and also a percentage split of the main problems.
Lack of coverage explains half the debt, with design, comments and complexity as other issues. There are very few violations and duplications, the happy result of running with Checkstyle, Findbugs and PMD inside Eclipse during the development.
I always add a Most Violated Rules widget to the project dashboard. Exposing internal representation is the most common here as the very bad package cycles.
 The "Most Violated Resources" widget instantly tells me that the objects used to ferry query parameters around are the main problem area. I have a tagged sonar-project.properties file so I will be able to see progress in the future on lines of code, technical debt and documented API.
 Issues are mostly Critical and Major, so need to be fixed urgently. 1% duplications is not that serious, even though 0% is best of course. Test coverage is more serious as we've seen above that lack of Test Coverage accounts for half of technical debt. This maybe because the build is not yet configured to execute tests.
 The complexity stats show mainly whether design is good, a method should do one thing, a class should have one responsibility. The LCOM4 measure of 1.0/class is quite positive.
 The main problem in these is the startling 40.5% of package tangle index and more than 10 cycles!
This needs to be looked at with highest priority.
Geen opmerkingen:
Een reactie posten